Using VIX to determine short-term NIFTY ranges
This study attempts to use VIX (Volatility Index) to determine short term ranges for NIFTY and compares the result with the actual historical data.
Introduction
VIX or Volatility index essentially defines the statistical boundary for NIFTY in the future. Precisely, a value of VIX indicates that NIFTY is likely to remain within the VIX percentage in the next 1 year with 67% probability (that is within 1st standard deviation). For example, if NIFTY is at 10,000 and VIX is at 15, this means that NIFTY is likely to remain within 8,500 to 11,500 in next 1 year, with 67% probability.
It is, however, possible to use VIX to determine the short term ranges for NIFTY as well, say for next T = 7 days. For that, the VIX range will need to be scaled with square root of (TD/T), where TD = total available trading days in 1 year and T = duration of the shorter term.
This study attempts to use this technique to determine the short-term NIFTY ranges and then compare them with actual data to determine the effectiveness of using VIX for short term range prediction.
Programmatic Approach
We will conduct a study for approximately 34 months of data, starting from January 2020. We will try to use VIX to predict the ranges of NIFTY in the next T = 7 days. Let's begin.
import math
from nsepy import get_history
from datetime import date
from numpy import ceil

# Get all daily nifty price data since January 2020
nifty = get_history('NIFTY',
                                start=date(2020, 1, 1),
                                end=date(2022, 10, 24),
                                index=True)

# Get the VIX data for the same period
vix = get_history('VIX',
                              start=date(2020, 1, 1),
                              end=date(2022, 10, 24),
                              index=True)

# Add the VIX in same dataframe
nifty['vix'] = vix['Close']

# Now, we will calculate PERIOD = 7 day range of
# NIFTY for any given day
PERIOD=7
variance = nifty['vix']/math.sqrt(252/PERIOD) / 100
nifty['pred_range'] = nifty['Close'] * variance

# And predict max and min values of NIFTY on the 7th day.
# There is 67% chance (first Standard Deviation)
# that NIFTY will remain in this range.
nifty['pred_min'] = ceil(nifty['Close'] - nifty['pred_range'])
nifty['pred_max'] = ceil(nifty['Close'] + nifty['pred_range'])


nifty
Let's see what we got so far -
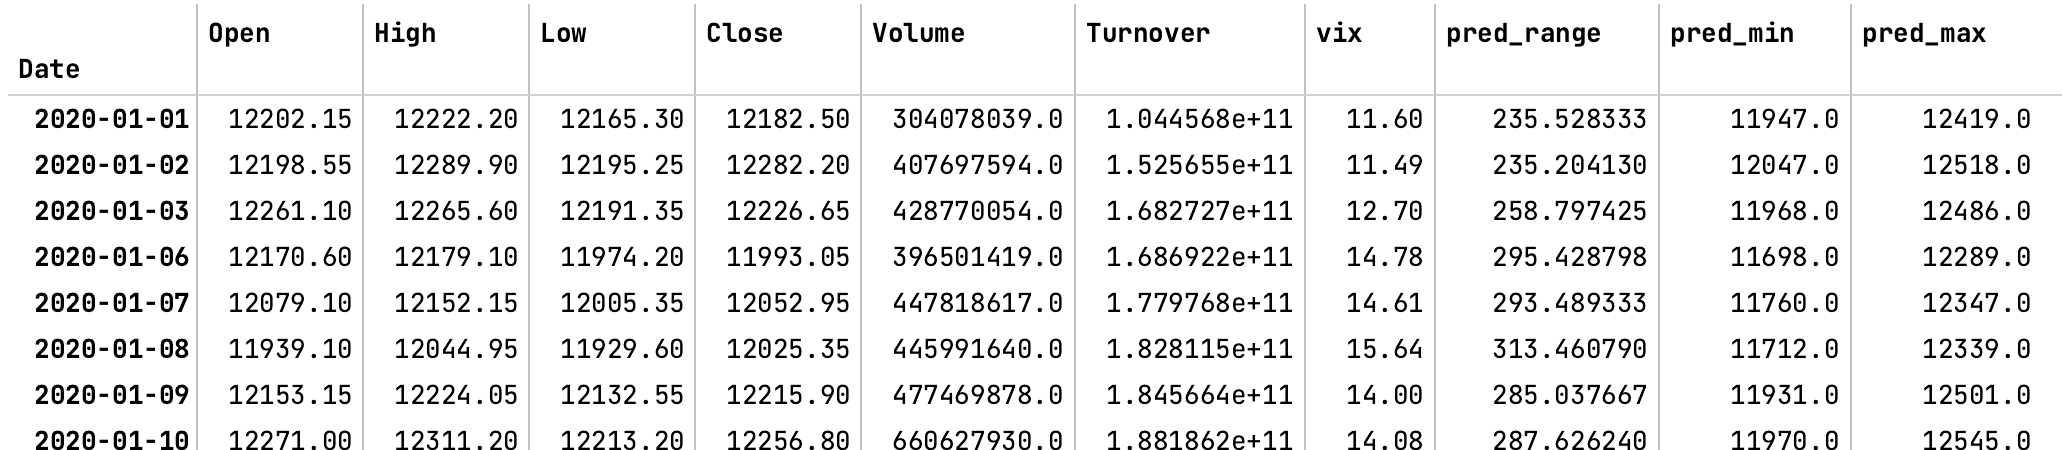
As you can see above, for each day, the last 2 columns (pred_min and pred_max) tells you the minimum and maximum of NIFTY values expected within the next 7 days.
Now, we need to see if NIFTY actually remained within this predicted range in next 7 days.
# Now let's add the actual max and min
# values of NIFTY in the next 7 days
nifty['act_min'] = nifty['Close']
                   .rolling(PERIOD, 1).min()
nifty['act_max'] = nifty['Close']
                   .rolling(PERIOD, 1).max()
# So, how many times do NIFTY
# breach the VIX boundary? Let's find out.
nifty['breached'] = nifty['act_min'].le(nifty['pred_min'])
                     | nifty['act_max'].ge(nifty['pred_max'])

# calculate how many times breached occurred
nifty['breached'].sum() * 100 / nifty['breached'].count()
The answer that comes out is - 28.82%.
In other words, NIFTY remains within the predicted range in 100-28.82 = 71.18% of days.
Conclusion
This result is slightly better than the expectation. Since VIX represents z-score corresponding to 1st Standard deviation, I was expecting NIFTY to remain within the range for 67% of cases. As it appears, NIFTY was actually within the range for ~71% of cases.
Please note that the above result is based on the NIFTY's Closing price. It is possible that NIFTY have breached more than that if we perform the analysis based on intraday low/high prices.
Next, let's try to find the effectiveness of VIX for multiple short term periods and over the years.